BIOL570 Lab 11. Analysis of variance (ANOVA)
Goals
ANOVAs (analyses of variance) are used widely in scientific research for situations where one is comparing means of two or more groups. In this laboratory, we will focus on a one-way ANOVA, which means that there is a single response variable (numerical) and a single explanatory variable (categorical).
First go to this hands-on exercise on ANOVA.
Recognize that the diagram represents a situation where one is comparing four different groups (for example, asking if mean mass differs for four species of rodents). The groups are labeled W, X, Y, and Z. The horizontal line within each orange box refers to the mean of each group. The height of the orange around the mean reflects the variability within each group. You can change the mean of each group with the controls labelled "means".
NOTE: it takes a moment after you stop changing a slider for the plots in the right panels to update. Be patient.
The dashed line on the plot, shows the mean of the four groups; it changes (slowly) as you modify each group's mean. The variability within can be increased or decreased using the sliders labelled "standard deviations". Below the diagram are images that show the numerator (called "MS Between") and denominator (called "MS Within") of the F statistic (called "F-Ratio"), as well as the magnitude of the F statistic.
Once you understand how the diagram works (see instructions below the diagram if needed), use it to explore ANOVA concepts.
Question 1 Create (A) a diagram that has a very large F statistic and (B) a diagram that has a very small F statistic. Recall that the magnitude of the F statistic is portrayed by the length of the blue bar. Make a sketch of both diagrams on the back of your worksheet and label them (A) and (B).
Question 2 Write a short paragraph on the back of your worksheet that explains: a) how the magnitude of the F statistic relates to 1) how similar/different the four different sample means are and 2) the extent of variability in each of the four samples and b) why we call the test an “analysis of variance” when the goal of the hypothesis test is to compare means?
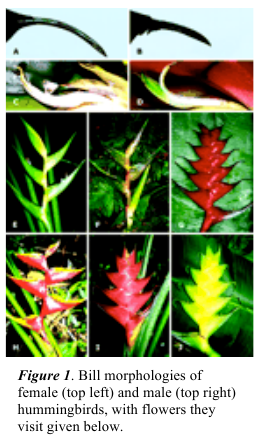
Temeles and Kress (2003) were studying ecological and evolutionary interactions between hummingbird pollinators and floral morphology in the plant genus Heliconia. The hummingbird Eulampis jugularis is the sole pollinator of the plant species being studied. The scientists hypothesized that the beak length of the male and the female birds has coevolved with the length of the flowers.
In Figure 1, the bill of the female bird is shown on the top left and the bill of the male bird is shown on the top right; below each bill are flowers that the birds visit, which appear to match the bill length of the bird. The lower panels show the inflorescences of these plants on two different Caribbean islands.
A key question in their research was “are there distinct differences in average floral length among the three plant species?” Thus, the scientists measured floral length (mm) of three different plant species.
Question 3. What is an appropriate null and alternative hypothesis for this research problem?
Question 4. What is the response variable? Is it numerical or categorical? What is the explanatory variable? Is it numerical or categorical?
Step 1: Execute the following in RStudio
lengths = c(47.12, 48.07, 46.75, 48.34, 46.81, 48.15, 47.12, 50.26, 46.67, 50.12,
47.43, 46.34, 46.44, 46.94, 46.64, 48.36, 41.90, 39.63, 38.10, 42.01,
42.18, 37.97, 41.93, 40.66, 38.79, 43.09, 37.87, 38.23, 41.47, 39.16,
38.87, 41.69, 37.40, 37.78, 39.78, 38.20, 38.01, 40.57, 38.07, 36.78,
35.12, 37.02, 36.82, 36.52, 36.66, 36.11, 35.68, 36.43, 36.03, 35.45,
34.57, 38.13, 34.63, 37.10);
sp = c("Hb", "Hb", "Hb", "Hb", "Hb", "Hb", "Hb", "Hb", "Hb", "Hb", "Hb", "Hb",
"Hb", "Hb", "Hb", "Hb", "Hcr", "Hcr", "Hcr", "Hcr", "Hcr", "Hcr", "Hcr",
"Hcr", "Hcr", "Hcr", "Hcr", "Hcr", "Hcr", "Hcr", "Hcr", "Hcr", "Hcr", "Hcr",
"Hcr", "Hcr", "Hcr", "Hcr", "Hcr", "Hcy", "Hcy", "Hcy", "Hcy", "Hcy", "Hcy",
"Hcy", "Hcy", "Hcy", "Hcy", "Hcy", "Hcy", "Hcy", "Hcy", "Hcy");
data = data.frame(length=lengths, species = sp) ;
print(data);
The column of flower lengths is in mm, and the species column that identifies the plant species of each measured flower (1 = H. bihae, 2 = H. caribaea (red morph), 3 = H. caribaea (yellow morph).
Question 5. Write out an ANOVA table on your worksheet (i.e. think about the columns of the table should be and what the rows should be). Fill in the degrees of freedom column.
From looking at the data set, you should know the “groups degrees of freedom” and the “total degrees of freedom” and thus be able to calculate the “error degrees of freedom”. We will next carry out an ANOVA using R. R has a very terse syntax for specifying an ANOVA. The function name is aov and for the first argument, you specify the response variable then the tilde character ~ then the explanatory variable(s). The function returns an object that describes the ANOVA results. For our dataset we can use:
fit = aov(length ~ species, data=data) ;
print(fit) ;
To see a more familiar presentation of the results use the summary function:
summary(fit) ;
Look at the table: did you correctly answer Question 5?
Question 6: Fill in the rest of the ANOVA table on your worksheet using the R output.
Question 7: Think about theoretical concepts with ANOVA. Assume that the null hypothesis is true.
Under that situation, write down the two numbers in the ANOVA table that both estimate σ2 (the true population variance in flower length).
Question 8: Clearly the numbers you wrote down for Q5 seem quite different. These two numbers are different because: (SELECT ONE)
⬜ There are large differences between species means.
⬜ There are large differences between individual flower lengths within a species.
Question 9: What number in the ANOVA table is the test statistic? Show how this number is calculated from other numbers in the table.
Question 10: What do we know about the probability of getting this test statistic, or a number more extreme, if the null hypothesis is true?
Question 11: When you looked at the column of flower lengths, there was considerable variability (i.e. some flowers were as large as 50 mm while others were as small as 34 mm). What proportion of the variability in flower length can be explained by knowledge of what plant species the flower was on?
Question 12: Write a complete conclusion for this study, including all important pieces of information we have emphasized in lecture.
The results of this ANOVA were one of several pieces of evidence that Temeles and Kress used to suggest that hummingbird pollinators have selected for divergence in floral traits in these plant species.
References: Temeles, Ethan J., and W. John Kress. "Adaptation in a plant-hummingbird association." Science 300.5619 (2003): 630-633.