BIOL570 Lab 9: t-tests
Part of this lab is based on “Lab Manual for Analysis of Biological Data” by Michael Whitlock.
Review the summary of the chapter.
Step 1: Work through the Lab_09_ExampleTTests.pdf to answers Questions 1 - 5.
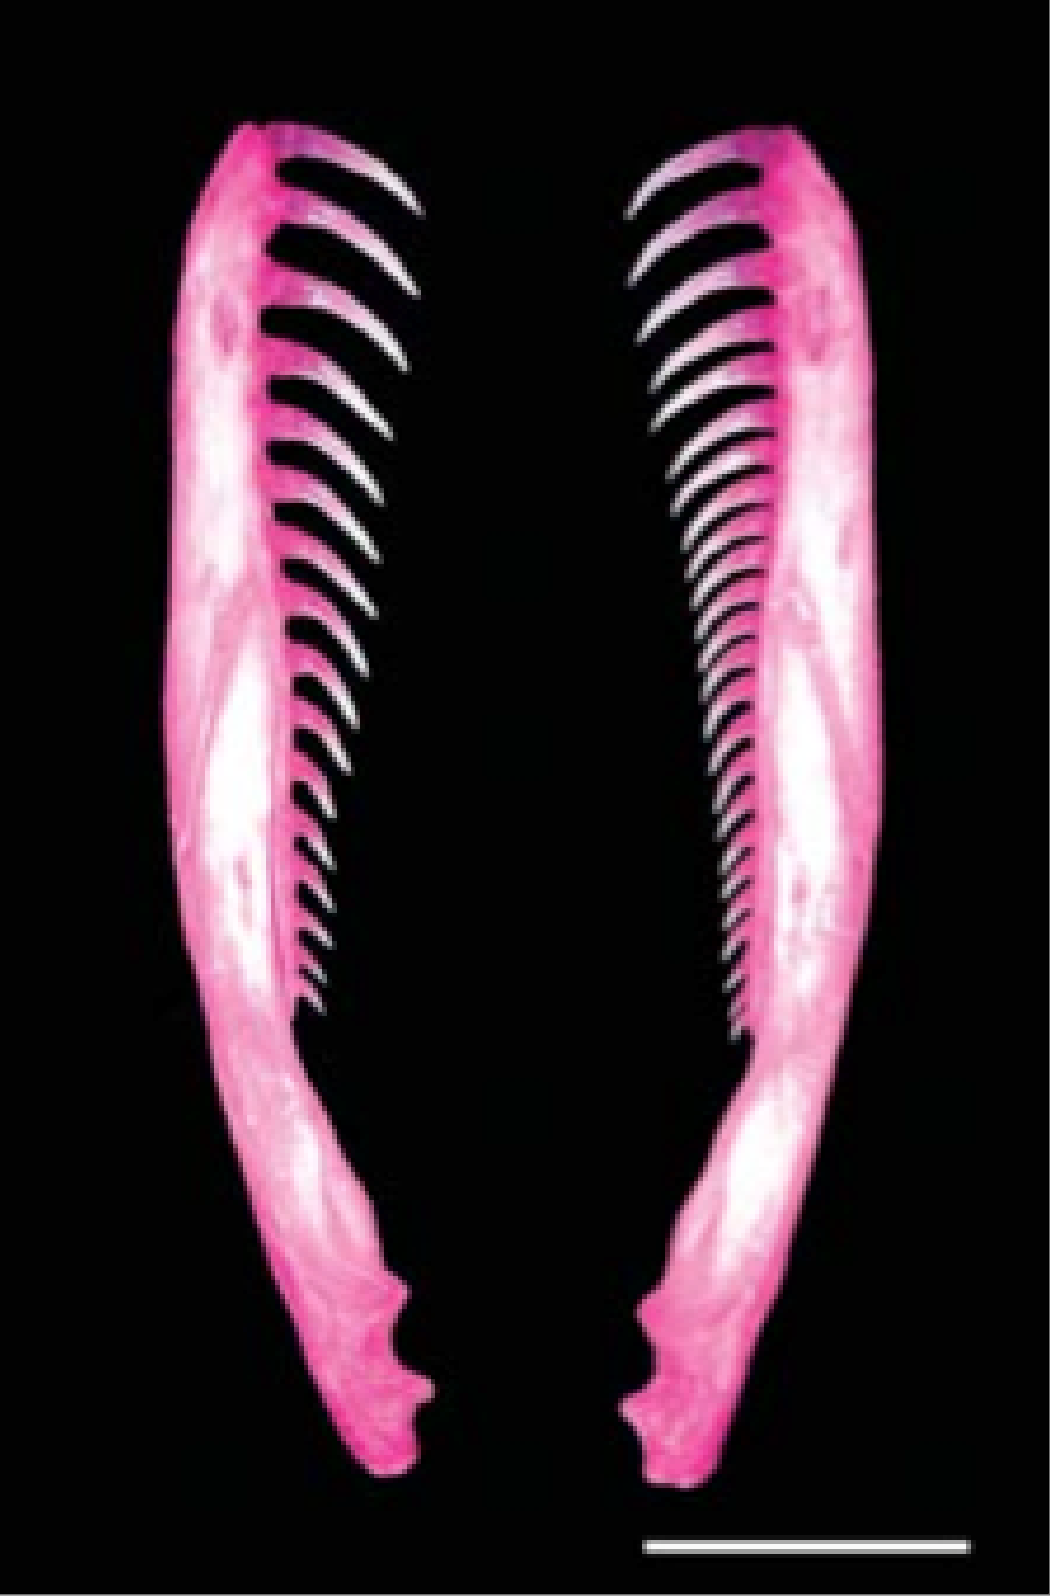
Now we will look at a data set on the degree of asymmetry in snakes that feed on snails. Most vertebrate species display very little asymmetry between their left and right sides. Are snail-eating snakes an exception to this general rule? Because most snail shells coil to the right, a snake might be more efficient at extracting snails from their shells if it has more teeth on the side of the head that is placed next to the opening of the snail’s shell.
Twelve species of snail-eating snakes in the genus Pareas were scored for asymmetry in their jaws. The asymmetry measurement used was the number of teeth in the right minus the number of teeth in the left jaw. If the right jaw has more teeth then the difference will be positive. If left jaw has more teeth then the asymmetry score would be a negative number, and if an individual has the same number of teeth in each jaw the score would be 0. While the score for any individual snake will be an integer, we will be dealing with the mean asymmetry scores for different species. So our data will be continuous. In this lab we will treat each species as if it were a separate random data point[1]. We will test whether or not there is evidence for asymmetry in these snakes.
Step 2: Execute the following lines in RStudio:
raw = "species,asymmetry
Pareas stanleyi,8.048
P. nuchalis,10.916
P. margaritophorus,12.191
P. macularius,16.813
P. iwasaki,17.45
P. hamptoni,8.845
P. formosensis,15.857
P. chinensis,14.422
P. carinatus,10.916
P. bolengeri,10.438
Asthenodipsas vertebralis,16.255
Asthenodipsas laevis,17.371"
fakefile = textConnection(raw)
data = read.csv(fakefile, header=TRUE)
print(data)
Question 6: What are the appropriate null and alternative hypotheses for our question about asymmetry in snail-eating snakes?
Question 7: Based on our null hypothesis, what is the most appropriate test to perform?
Step 3: Use:
summary(data$asymmetry) ;
sd(data$asymmetry) ;
require(pastecs) ;
stat.desc(data$asymmetry) ;
to get a sense of the data. The stat.desc function is in the optional R package called pastecs, that is why we had to use the require statement to load that package.
If you see a message which ends in something like “here is no package called ‘pastecs’” then you will need to execute the command
install.packages("pastecs");
And then try the the last 2 lines again.
Step 4: Use:
hist(data$asymmetry) ;
to generate a histogram for the data.
Based on the summary statistics and histogram, do you expect that we will reject the null hypothesis?
Step 5: Question 8: Use the summary statistics that you looked at above to calculate a t-statistic by hand:

Step 6: Normally when we are working with R, we would not calculate the t-statistic by hand. We can ask R to perform the test in its entirety:
t.test(data$asymmetry, mu=0.0) ;
where the mu=0.0 is how we tell R what the null hypothesized value of  is.
is.
Question 9: What was the P-value reported by R? Make sure that the t-statistic agrees with the one that you calculated for question #8?
Question 10: What should we conclude from this study?
Step 7: Recall that we can produce a 95% confidence interval for a mean, by centering an interval extends for t0.05(2),df SEȲ in each direction around our point estimate of the mean (Ȳ).
Make sure that you know how to read the Student’s t-distribution table in your book to find the appropriate value for t0.05(2),df , but we can also ask R for this value using a syntax like:
qt(0.975, df=11) ;
to return the inverse of the cumulative distribution function (CDF) of the t-distribution with 11 degrees of freedom at the probability 0.975. The “inverse of the CDF and some continuous distribution for probability p” means the cutoff value such that p of the probability distribution is below the value and (1-p) is above the cutoff. What is the inverse for probability p=0.025 for the t-distribution with 11 degrees of freedom? What is the inverse for a t-distribution and p=0.5?
Modify the last R command to check your answer. Make sure that you understand how these cutoffs correspond to the t0.05(2),11 value that you can look up in your text’s table.
Calculate the 95% confidence interval of the mean manually. Make sure that your answer agrees with the confidence interval reported by R in the output for the t-test.
Question 11: Fill in the blanks on the worksheet.
[1] Technically, we should account for the fact that some species are more closely related to each other; so these twelve species cannot be viewed as twelve independently sampled data points. Correcting for this deviation from truly random sampling requires a fair amount of phylogenetic theory which we will not cover in this course, so we’ll simply treat the data as if it were from a random sample for the sake of today’s lab.