| Click "Add 1 bootstrap rep" to draw a pseudoreplicate | ||
| 0 replicates done | ||
| |
||
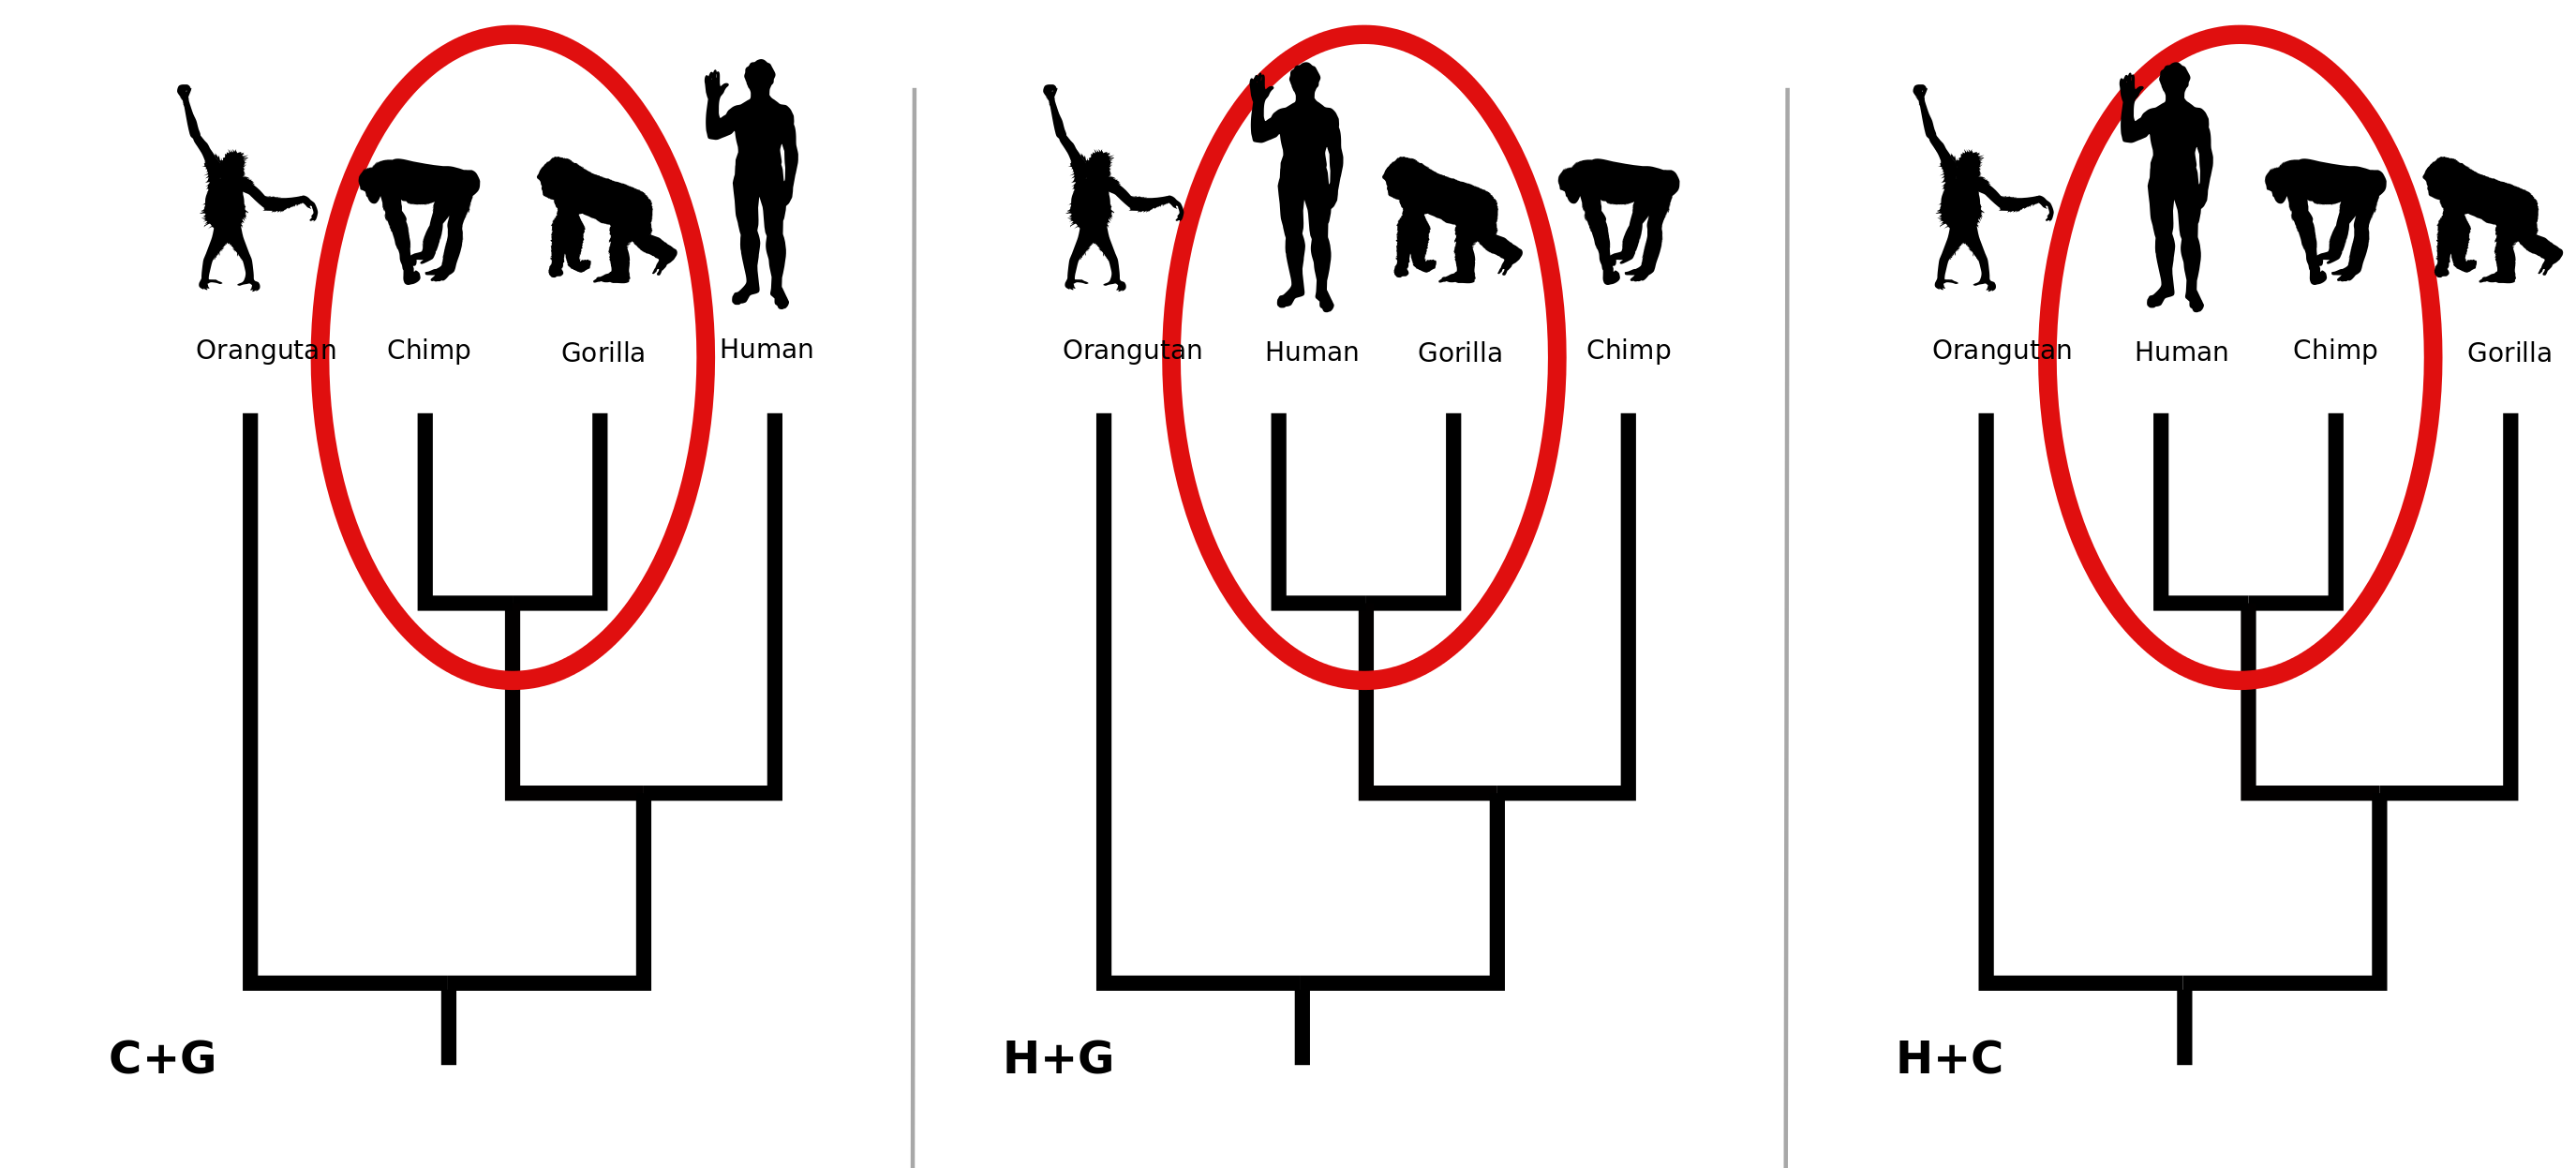
This page demonstrates the non-parametric bootstrap for phylogenetics (Felsenstein, 1985). The top character table represents a (fictitious) alignment of DNA sequences from 4 primates. Assuming that the orangutan is the outgroup and disregarding the possibility that the three lineages leading to humans, chimpanzees and gorrillas divergend simultaneously leaves us with 3 possible trees for these data, shown above. Humans could be sister to chimps (H+C). Humans could be sister to gorillas (H+G). Or chimps and gorillas could be most closely related to each other (C+G).
Columns shown in grey are sites which have no preference for any of the trees according to the parsimony criterion. In other words, all three trees explain these sites equally well. Sites that favor the human+chimp tree are shown in red; sites favoring the human+gorilla tree are in blue; and sites favoring the chimp+gorilla tree are in green.
In this (contrived) data set there are 3 sites favoring the H+C tree, 2 favoring the C+G tree, 1 favoring the H+G tree, and 4 sites that do not prefer any of the trees. Thus the point estimate of the best relationships (under the parsimony criterion) would be the H+C tree.
Bootstrapping tries to help us determine if we should be confident that this estimate is not an artifact of sampling error.
The recipe for bootstrapping is to draw new data sets from your original data by sampling with replacement. For each pseudoreplicate dataset, you can estimate the best tree. If there groupings in the tree are disturbed by this resampling, you will fail to see those groups recovered in a large fraction of the bootstrap replicates. The bootstrap proportions for these groups will not be close to 100%, and you can conclude that the amount of signal present in the original data for these groups could plausibly be explained by sampling error.
The triangle on the bottom shows a representation of the frequency of the parsimony-informative sites in pattern frequency space. This coordinate system is explained here. The observed data set is depicted as a white circle.
Each time you click the bootstrap button, you will see a pseudoreplicate dataset being drawn from the original dataset. As the bootstrap replicate is being drawn, you will see its parsimony-informative pattern spectrum update with each parsimony-informative pattern that is added. This shows up as the yellow circle moving during the bootstrap draws. This moving circle is just to give you a sense of how the coordinate system works - the only result that matters is which tree is favored when you have drawn a number of characters equal to the size of the original data (10 in this example).
When a full bootstrap resampled data set is created, we can decide which tree is favored by the pseudoreplicate. If there are ties we give each of the two trees 1/2 credit (or give each of the 3 trees 1/3 credit in the event of a three-way tie for which tree is the best explanation of the pseudoreplicate). The bootstrap proportions for each of the 3 trees are updated each time you finish a bootstrap replicate. The previously sampled datasets remain as small black dot in the pattern-frequency space figure.
In a real analysis, you would want to perform hundreds of bootstrap pseudoreplicates before you put much faith in the bootstarp proportions. Note that on larger examples, a tree search must be performed. With parsimony and only 3 possibilities, we can simply figure out which tree is preferred by whether the most frequent informative patterns are red, green, or blue.
Further information on toplogical testing will be available in a forthcoming "Encyclopedia of Evolution" article by Emily Jane B. McTavish and Mark T. Holder.
Back to the demo table of contents...
Source code at https://github.com/mtholder/mephytis
Thanks to the U.S. National Science Foundation and the Heidelberg Institute for Theoretical Studies for support.